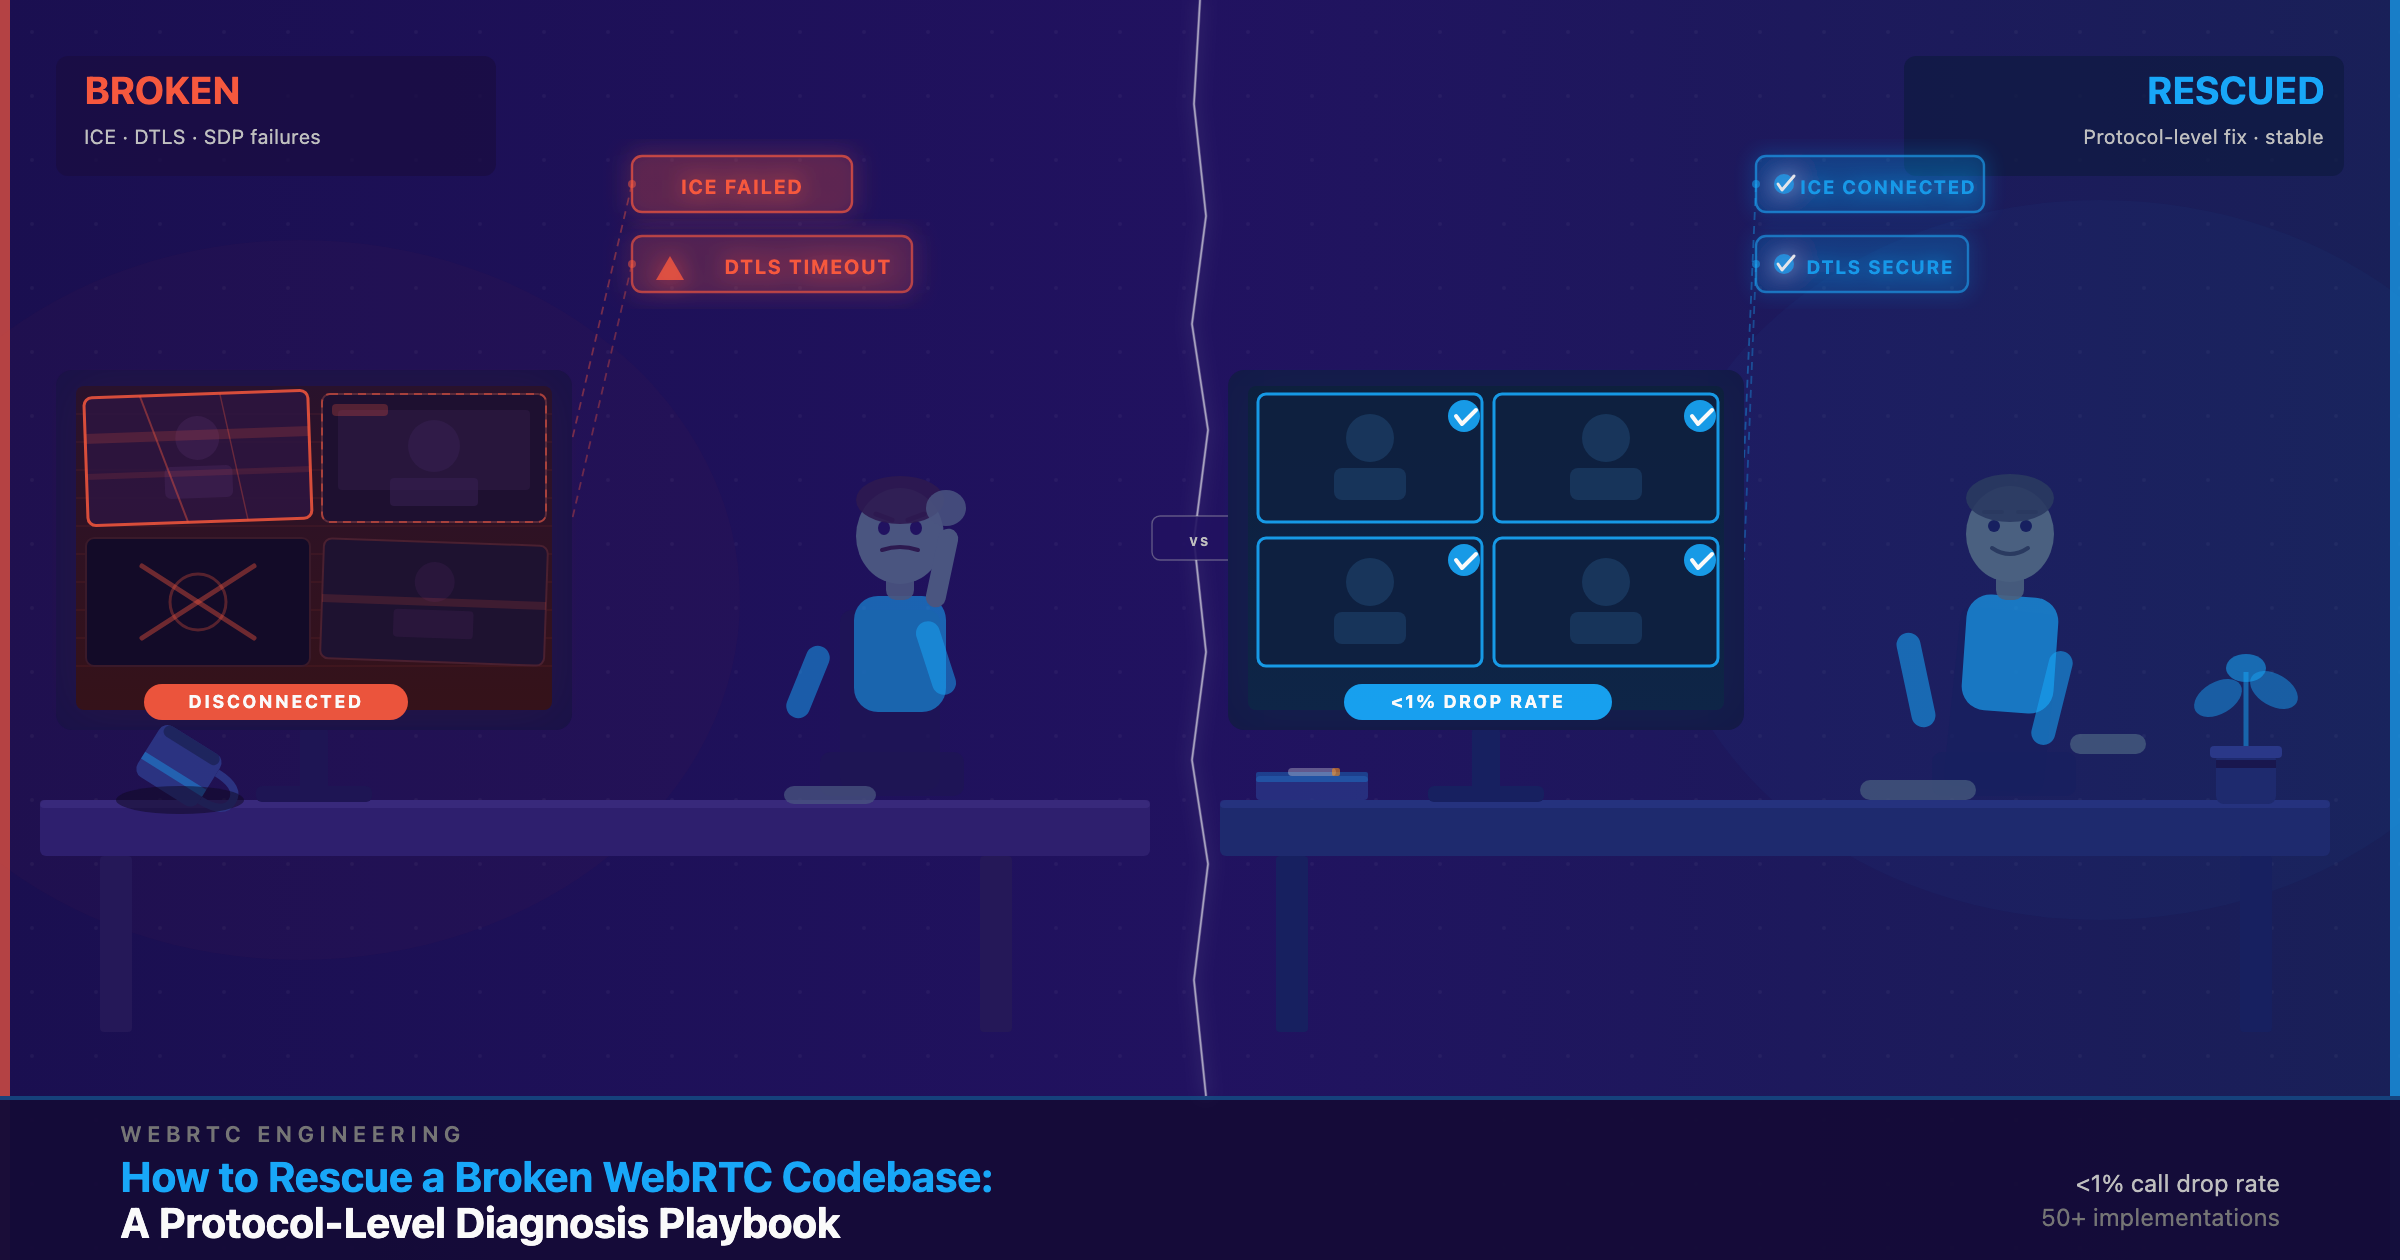
A WebRTC rescue is what happens when a live video product is failing — calls drop, connections hang on “connecting,” audio goes one-way — and the team that owns the code can’t find the root cause. Usually the codebase was inherited or built by a team that has moved on, and the engineers left holding it are strong in React and Node.js but have never manually debugged ICE or read an SDP. Protocol-level diagnosis means going below the API and SDK surface to inspect the actual WebRTC exchange: SDP negotiation, ICE candidate gathering, the DTLS handshake, codec/media negotiation, and media server configuration. Almost every WebRTC failure has a specific root cause at a specific layer. The common mistake is patching symptoms instead of finding that layer. This playbook gives you a step-by-step diagnosis sequence you can run yourself — or hand to a specialist.
What Does “WebRTC Rescue” Actually Mean — and Why Do Most Fixes Fail?
A rescue starts from a specific situation: the product is live, real users are on it, and calls are failing in ways nobody on the current team can explain. The codebase came from somewhere else — an agency that delivered and left, a founding engineer who’s gone, or a prior vendor who “finished” the project. There’s often no documentation. Two failure modes dominate. First, teams apply fixes at the application layer — retry logic, UI reconnect banners, SDK upgrades — when the real problem lives in the protocol exchange underneath. Second, they don’t know which layer to inspect first, so they change several things at once and can’t tell what helped.
Trembit has delivered 50+ video and voice implementations across healthcare, education, and enterprise, and rescues are a core part of that work — inheriting someone else’s broken code and getting it to production. The platforms we take over often arrive with call drop rates in the 10–15% range; stabilized at the protocol level, they run under 1%. One of them was Meetaway, whose founder Whitney Kramer put it plainly via Clutch: “They know the inner workings of the tech and were able to inherit our semi-functional code and get it to work where multiple prior teams couldn’t.” Why WebRTC failures are specialization problems, not engineering problems
How Do You Diagnose a Broken WebRTC Connection? (The 5-layer framework)
Every WebRTC connection is built from five dependent layers, and diagnosis runs strictly top-down:
SDP → ICE → DTLS → Codec/Media → Media Server.
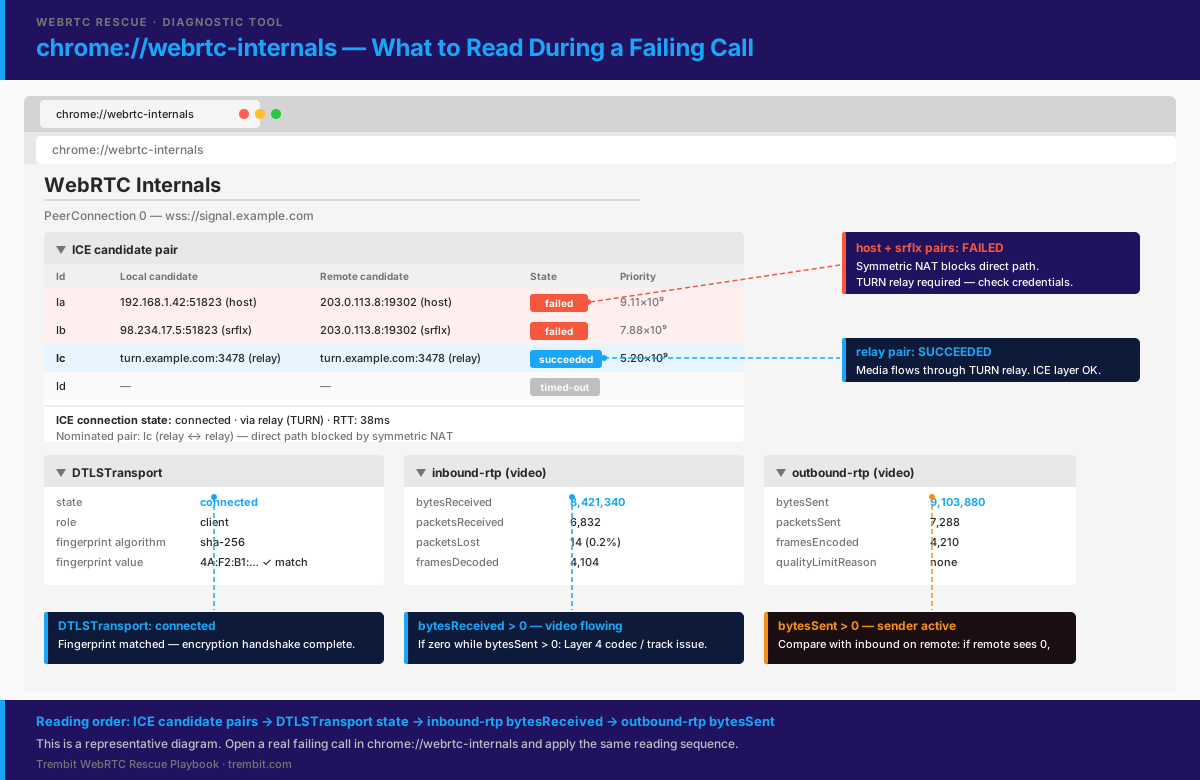
The order matters because each layer depends on the one above it. If the SDP offer/answer never completes correctly, there’s no point analyzing ICE; if ICE never finds a working candidate pair, the DTLS handshake can’t even begin. Working top-down means you stop at the first layer that’s broken instead of chasing symptoms that are really side effects of an earlier failure. The entry point for all five is the same: open chrome://webrtc-internals during a failing call and read the state. The framework below is the sequence — each layer names what to check, the tool that shows it, and the symptom you’ll see when that layer is the one that failed.
Layer 1 — Does the SDP offer/answer exchange complete correctly?
SDP (Session Description Protocol) is the contract two peers agree on before any media flows. It declares the media formats, direction, and connection parameters each side supports. When you diagnose here, you’re reading the actual offer and answer, looking for malformed m= lines, mismatched codec lists, missing ICE credentials (ice-ufrag/ice-pwd) in the SDP body, and direction conflicts — one side offering sendrecv while the other answers recvonly. The signature symptom of a Layer 1 failure: signaling completes cleanly, both sides think they’re connected, and media never flows. A concrete example we see often: a mobile client sends an offer listing H.264 as its only video codec, while the server-side media server only offers VP8. There’s no overlap, negotiation silently produces no usable video track, and no error is thrown. Read the SDP in WebRTC Internals; for server-side signaling, capture it with Wireshark.
Layer 2 — Are ICE candidates being gathered and exchanged?
ICE (Interactive Connectivity Establishment) is how two peers discover the best network path between them — gathering candidate addresses, using STUN to learn public IPs for NAT traversal, and using TURN to relay media when a direct path is impossible. This is where most “can’t connect” failures live. Common causes: expired or wrong TURN credentials, a TURN relay port blocked by a firewall, candidate gathering that times out on strict-NAT mobile networks, or only host candidates being exchanged when a symmetric NAT means a relay candidate (routed through TURN) is required. In WebRTC Internals you’ll see each candidate tagged by type — host, srflx (server-reflexive, discovered via STUN), or relay (via TURN); inspect the candidate pairs, and if there is no pair in the succeeded state, the connection never found a path. For context on scale, WebRTC analyst Tsahi Levent-Levi estimates roughly 20% of connections need a TURN relay to connect at all — so a broken TURN setup breaks a real, significant slice of your traffic.
Layer 3 — Does the DTLS handshake complete?
DTLS (Datagram Transport Layer Security) is the encryption handshake that must complete before any media is allowed to flow. Failures here are rarer than ICE failures but harder to spot, because they’re silent: ICE succeeds, the connection looks like it’s establishing, then it just times out. Two causes account for most Layer 3 failures. A certificate fingerprint mismatch between the value declared in the SDP (a=fingerprint) and the actual DTLS certificate — common right after a server config or infrastructure change. WebRTC verifies the peer’s self-signed certificate by comparing this SHA-256 fingerprint hash, not by validating a PKI chain, so a mismatch fails the handshake outright. The second common cause is a middlebox or firewall stripping DTLS packets. (Severe clock skew can in theory trip certificate validity-window checks, but most WebRTC stacks are lenient here precisely because the certs are self-signed and short-lived — so treat it as a rare, implementation-specific cause, not a first thing to check.) To diagnose, filter for DTLS in Wireshark to watch the handshake, and in WebRTC Internals look for a DTLSTransport in the failed state. Encryption is also a compliance surface — see how we handled encryption posture in the KBV-certified psychotherapy platform.
Layer 4 — Are codecs negotiated and are media tracks active?
Even after DTLS succeeds, media can still fail to flow. Two things to check. First, track state: are the audio and video tracks actually live, or is a track muted or ended? Second, codec agreement: is the negotiated codec supported by every participant — browser, mobile client, and media server alike? Simulcast is a frequent culprit: the SFU expects multiple encoded layers, but the client isn’t sending them, so the server has nothing to forward. This usually means addTransceiver() was called without an encodings array defining the simulcast layers, or the SDK’s simulcast option was never enabled and the SDP offer omits the a=simulcast: attribute entirely. The classic Layer 4 symptom is one-way media — the sender’s track is active and encoding, but the receiver shows a muted track or a frozen frame. In WebRTC Internals, read the outbound-rtp and inbound-rtp stats and confirm bytesSent and bytesReceived are actually incrementing. Zero bytes received against non-zero bytes sent points straight here.
Layer 5 — Is the media server configured correctly for your call topology?
The media server — Janus, mediasoup, LiveKit, Jitsi, or Kurento — sits above raw WebRTC but below your application. Failures here don’t stop calls from connecting; they make them degrade. Video freezes under load, you hit an unexpected participant ceiling, CPU spikes, or bandwidth estimation ignores real network conditions. The tell is topology-dependent: it works fine for 2 participants and breaks at 10. Audit the SFU’s selective forwarding rules, the simulcast layer-selection logic, and — critically — TURN integration: is the media server using the same TURN configuration as the clients? Check the bandwidth estimation method (REMB vs. the newer TWCC) and the recording pipeline, because a misconfigured recorder can starve media threads. If you’re choosing or re-architecting at this layer, our comparison of Janus vs. mediasoup vs. LiveKit for telemedicine covers the trade-offs. Trembit runs all five of these media servers in production.
What Tools Do Protocol-level WebRTC Engineers Actually Use for Diagnosis?
Diagnosis is only as good as the visibility you have into each layer. These are the tools that show the state the five-layer framework asks you to check:
chrome://webrtc-internals— the first tool every WebRTC engineer opens. It dumps all transport state, ICE candidate pairs, DTLS state, and RTP statistics live during a call, with no code changes.- webrtc-troubleshooter (test.webrtc.org) — a quick automated check of camera, mic, network reachability, and basic connectivity, useful for isolating a client-environment problem from a server-side one.
- Wireshark with DTLS/SRTP decryption — packet-level visibility into the handshake and media flow; the only way to prove a middlebox is stripping or mangling packets.
- coturn CLI / admin panel — diagnose TURN relay failures from the relay’s own side via coturn’s built-in telnet CLI (port 5766 by default) or its optional HTTPS admin panel; confirms whether allocations are actually being created and whether credentials are valid.
- Media server dashboards — mediasoup’s Prometheus metrics, the Janus admin API, and the LiveKit server dashboard expose CPU, bitrate, and per-participant state for Layer 5.
- The
getStats()/ WebRTC Stats API — programmatic access to the same data as WebRTC Internals, suitable for continuous production monitoring rather than one-off debugging.
What Does a Real WebRTC Rescue Engagement Look Like — Step by Step?
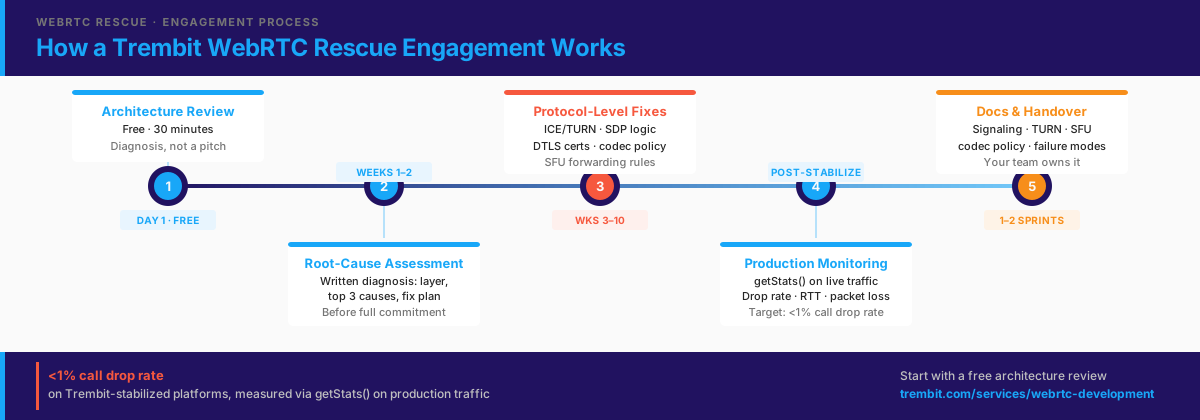
A rescue is a defined sequence with named deliverables and timelines, not “we’ll assess it and fix it.” Here is how Trembit runs one.
Step 1 — Free architecture review (30 minutes, diagnosis not pitch)
The first conversation is a 30-minute look at your video architecture — how signaling is wired, what media server you’re on, where TURN sits, what the failure symptoms are. You get an initial read on which layer the problem likely lives in. No pitch deck, no slide about our company history. The goal is that you leave the call understanding your own system better than when you started, whether or not you engage us.
Step 2 — Root-cause assessment (weeks 1–2, before full commitment)
Within the first two weeks — before you commit to a full engagement — we deliver a written root-cause assessment. It names the specific layer or layers where the failure lives, identifies the top three contributing causes with the evidence for each (candidate-pair dumps, SDP captures, DTLS state), and gives you a prioritized fix list ordered by impact. This is a deliberate commitment: we won’t bill a full sprint until you know exactly what’s wrong and what fixing it involves. It’s the core of our WebRTC development and rescue services, and it exists precisely so that “documented methodology” is a document you can hold, not a claim.
You’ll know exactly what’s wrong before you commit to anything beyond the assessment. Want the root-cause assessment for your platform? Start with a free 30-minute architecture review.
Step 3 — Protocol-level fixes, not symptom patches
Fixes go in at the layer where the failure actually lives — not one layer up where it’s easier. That means ICE/TURN reconfiguration, corrected SDP negotiation logic, DTLS certificate and fingerprint management, codec policy enforced at the media server, and corrected SFU selective-forwarding rules. This is the opposite of the “we rebooted the server and bumped the SDK” pattern that produces a quiet week followed by the same failures. A patch that doesn’t address the failing layer isn’t a fix; it’s a delay.
Step 4 — Call-quality monitoring and drop-rate tracking in production
A fix isn’t finished until production proves it held. After stabilization we instrument the platform — capturing getStats() data, connection success rates, and call drop rates on real traffic — so the improvement is measured, not asserted. Our stabilized platforms achieve a call drop rate under 1%, measured via getStats() monitoring on production traffic. Production monitoring is also what catches the next problem early, which is what turns a one-time rescue into a platform you can rely on.
Step 5 — Architecture documentation and knowledge transfer
If the original team left no documentation, we write it: the signaling flow, the TURN setup, the media server configuration, the codec policy, and the failure modes we found and fixed. Then we hand it back with knowledge transfer so your team can maintain and extend the platform without depending on us. It’s one of the most undervalued deliverables in a rescue, and it’s the difference between a platform you own and a black box you’re afraid to touch. And a rescue doesn’t have to end at handover: several of our engagements that began as inherited codebases have become multi-year partnerships — our longest-running client relationship has run seven years.
When Should You Call a WebRTC Specialist Instead of Debugging in-house?
Not every WebRTC bug needs a specialist — plenty are ordinary application bugs your team should own. Here are three signals that the problem has left general engineering territory.
- One: the failure is intermittent and environment-dependent — it works in the office and fails on mobile hotspots or corporate VPNs. That pattern is almost always a TURN/NAT issue at the ICE layer, not an application bug, and no amount of application-layer debugging will find it.
- Two: your team has shipped three or more patches and the drop rate hasn’t moved — a strong sign you’re treating symptoms above the failing layer. (And if you have no drop-rate telemetry at all — no
getStats()instrumentation in production — that absence is itself a signal: you can’t tell whether any patch is helping.) - Three: a compliance audit or an enterprise contract is approaching and the platform still isn’t stable. When the cost of instability is a failed KBV or HIPAA audit — not just dropped calls — the fastest path is a team that has already delivered in those regulated environments. Trembit has: the webPRAX Face2Face platform is Germany’s first KBV-certified psychotherapy video service.
If your drop rate is climbing while your team is stuck, you’re losing time you can’t recover. We’ve stabilized platforms in telemedicine (including Germany’s first KBV-certified therapy service), enterprise communication, and education — inheriting codebases with no documentation and no prior diagnosis. The fastest path to knowing whether we can fix yours is a 30-minute architecture review — this week — that tells you exactly which layer the failure lives at and what it takes to fix, before you commit to anything. Book a free architecture review with Trembit’s WebRTC engineering team.