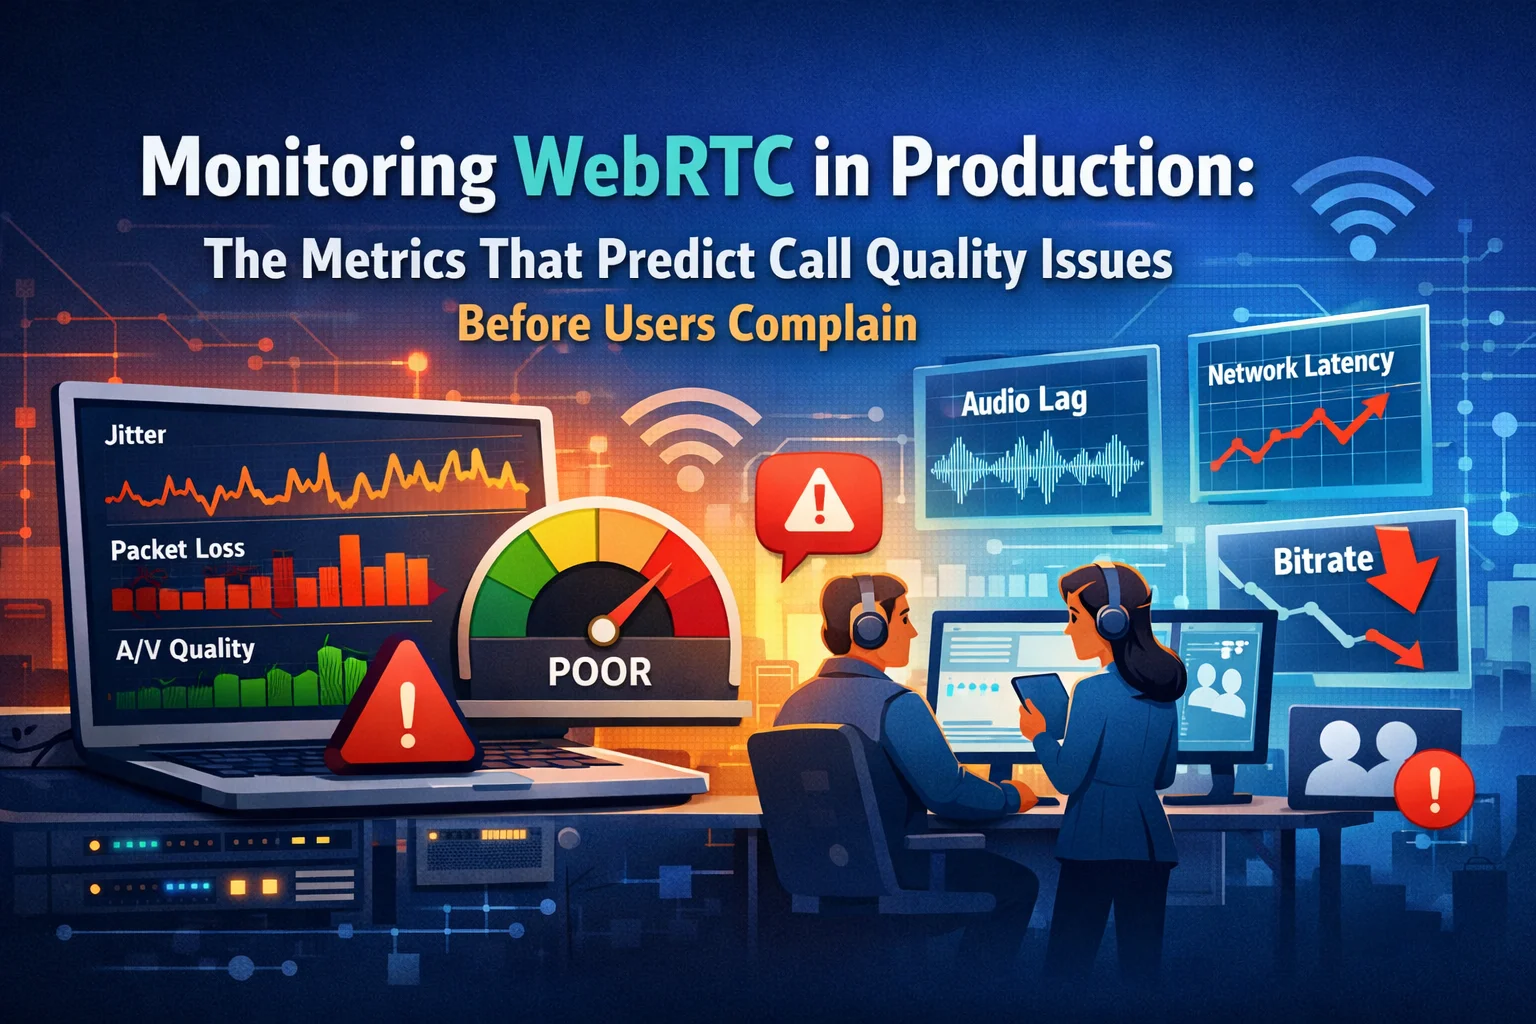
The worst way to find out your WebRTC platform has a quality problem is from users. By the time someone files a support ticket or leaves a negative review, dozens of other users have quietly given up, refreshed the page, or — in healthcare — abandoned the consultation entirely. Reactive monitoring in real-time media systems is a losing strategy.
The good news is that WebRTC gives you the data to be proactive. The RTCPeerConnection.getStats() API exposes a rich telemetry stream — packet loss, jitter, round-trip time, codec parameters, available bandwidth — that updates every second. Teams that instrument this correctly can detect a call heading toward failure minutes before the user experiences anything obviously wrong.
The challenge is knowing which metrics to watch, what thresholds signal genuine risk, and how to turn raw stats data into operational intelligence that your team can actually act on. Raw WebRTC stats are verbose, inconsistently named across browsers, and require derivation to be useful. Most teams either don’t instrument at all or instrument everything and drown in noise.
This article gives you the specific metrics that matter, the thresholds that predict problems, the derivation logic to get from raw stats to actionable signals, and the observability architecture that makes all of it usable in production.
Why Most WebRTC Monitoring Falls Short
The typical monitoring setup on a WebRTC platform looks like this: error events are logged, connection state changes are captured, and there’s a Datadog dashboard showing server CPU and memory. When a call fails, the engineering team looks at server logs, finds nothing obvious, and concludes the user had a bad network.
That conclusion is sometimes right and often wrong. The problem is that server-side metrics tell you almost nothing about call quality — because in WebRTC, the quality problem usually lives in the media path between clients, not on your servers. Server CPU fine, signaling latency fine, TURN bandwidth normal — and still a user is experiencing choppy audio and frozen video that will cause them to abandon the call in 90 seconds.
Real WebRTC observability requires client-side instrumentation. The browser is where quality is experienced, and getStats() is where quality is measured.
The getStats() API: What It Gives You
RTCPeerConnection.getStats() returns a map of stats reports, each identified by a type. The types that matter most for quality monitoring are:
- inbound-rtp — statistics for media being received
- outbound-rtp — statistics for media being sent
- candidate-pair — statistics for the active ICE candidate pair (the network path)
- media-source — statistics about the local media source (camera, microphone)
- codec — the codec in use for each stream
The API is polled, not pushed — you call it on an interval (typically every second or every two seconds) and compute derived metrics by diffing successive snapshots. The raw values are mostly cumulative counters, which means the useful metrics are rates and deltas, not absolute values.
The polling loop:
let previousStats = null;
setInterval(async () => {
const stats = await peerConnection.getStats();
const report = parseStats(stats, previousStats);
previousStats = stats;
sendToObservabilityPipeline(report);
}, 2000);
The parseStats function does the work of extracting the metrics that matter and deriving the rates from cumulative counters.
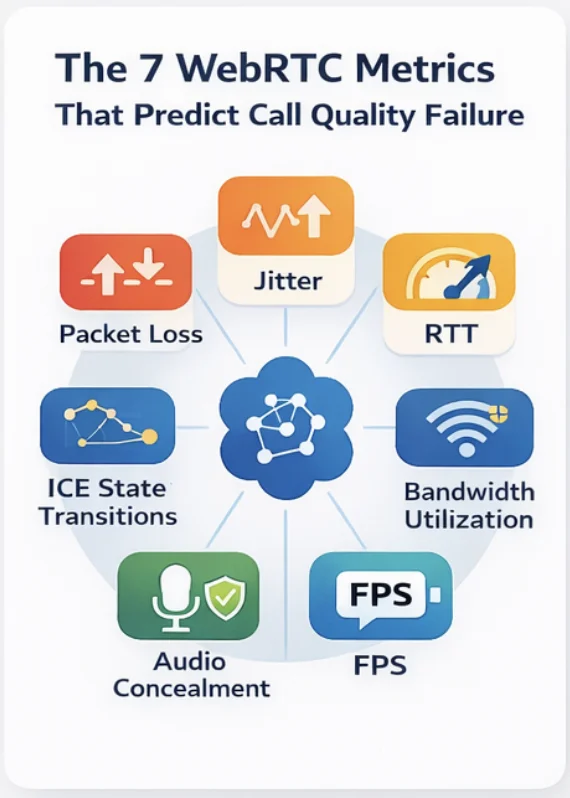
The Seven Metrics That Predict Call Quality Failure
1. Packet Loss Rate (Inbound and Outbound)
What it is: The percentage of RTP packets that were lost in transit over the last measurement interval.
How to derive it:
packetLossRate = (packetsLost_now – packetsLost_prev) /
(packetsReceived_now – packetsReceived_prev +
packetsLost_now – packetsLost_prev)
Thresholds:
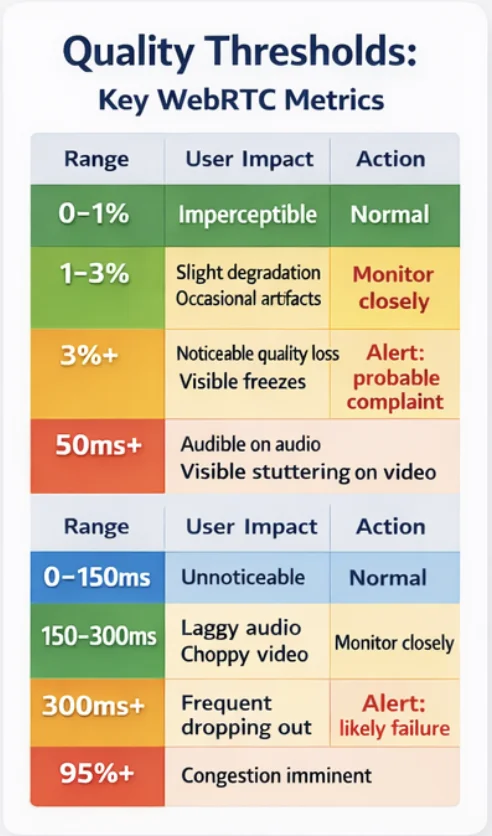
| Range | Audio Impact | Video Impact | Action |
| 0–1% | Imperceptible | Imperceptible | Normal |
| 1–3% | Slight degradation | Occasional artifacts | Monitor closely |
| 3–8% | Noticeable quality loss | Visible freezes | Alert: probable complaint |
| 8%+ | Severe disruption | Frequent freezes/blackouts | Alert: imminent failure |
Why it matters: Packet loss is the single strongest predictor of user-perceived quality degradation. Unlike jitter (which can be buffered), packet loss cannot be fully concealed. Audio codecs use packet loss concealment (PLC) to mask brief losses, but above 3% the concealment artifacts become audible. Video degrades more visibly because a lost keyframe causes decoding failure until the next keyframe arrives.
Watch separately for inbound and outbound. High inbound loss means the remote sender’s connection or the path to you is degraded. High outbound loss means your connection or the path to the remote receiver is degraded. The distinction matters for diagnosis.
2. Jitter (Inbound)
What it is: The statistical variance in inter-packet arrival times, measured in milliseconds. Packets sent at regular intervals arrive irregularly due to network queuing — jitter measures how irregular.
Where to find it: Directly available as jitter on inbound-rtp stats. No derivation needed.
Thresholds:
| Range | Impact | Action |
| 0–20ms | Imperceptible (buffer absorbs it) | Normal |
| 20–50ms | Minor buffer strain | Monitor |
| 50–100ms | Audible on audio; visible stuttering on video | Alert |
| 100ms+ | Severe degradation; playout buffer overrun likely | Alert: imminent quality failure |
Why it matters: WebRTC uses adaptive jitter buffers to smooth out packet arrival variance. The buffer absorbs jitter at the cost of latency — a deeper buffer adds more delay. When jitter exceeds the buffer’s capacity, packets are played late (causing stuttering) or dropped (contributing to loss). High jitter is often a leading indicator: it precedes packet loss as network conditions worsen.
3. Round-Trip Time (RTT)
What it is: The time in milliseconds for a packet to travel from the sender to the receiver and back. Available from candidate-pair stats as currentRoundTripTime.
Thresholds:
| Range | Impact | Action |
| 0–150ms | Imperceptible delay | Normal |
| 150–300ms | Slightly perceptible delay in conversation | Monitor |
| 300–500ms | Noticeable delay; conversation rhythm disrupted | Alert |
| 500ms+ | Satellite-like delay; turn-taking breaks down | Alert: intervention warranted |
Why it matters for healthcare specifically: In a clinical consultation, conversational delay matters more than in a casual call. Practitioners and patients rely on subtle timing cues — pauses, turn-taking signals — that high RTT destroys. Studies on telemedicine call quality consistently identify RTT above 300ms as a point where practitioners report reduced consultation effectiveness.
RTT also flags TURN relay vs. direct connection issues. A direct WebRTC connection typically has RTT under 50ms between users on the same continent. RTT jumping to 200–300ms often indicates the call has fallen back to the TURN relay, and the relay server’s location may be suboptimal.
4. Available Outgoing Bitrate vs. Target Bitrate
What it is: The estimated available bandwidth on the outgoing path, compared to the bitrate the codec is targeting. Available from candidate-pair as availableOutgoingBitrate, and target bitrate derived from outbound-rtp frame and packet rates.
The ratio that matters:
bandwidthUtilization = currentTargetBitrate / availableOutgoingBitrate
When this ratio approaches 1.0, the connection is bandwidth-constrained. WebRTC’s congestion control will begin reducing quality — dropping resolution, reducing frame rate — before the user notices audio degradation.
Thresholds:
| Ratio | State | Action |
| < 0.6 | Healthy headroom | Normal |
| 0.6–0.8 | Moderate utilization | Monitor |
| 0.8–0.95 | High utilization; quality reduction imminent | Alert: pre-degradation |
| > 0.95 | Constrained; active quality reduction in progress | Alert: user impact probable |
Why this is a leading indicator: Bandwidth constraint triggers quality reduction before packet loss increases. If you catch bandwidth utilization above 0.8, you can surface a “connection quality warning” to the user before they experience degradation — giving them the option to turn off video, reduce participants, or move to a better network location.
5. Frames Per Second (Video, Inbound and Outbound)
What it is: The actual frame rate being decoded/rendered (inbound) and encoded/sent (outbound), derived from the framesDecoded and framesSent counters on RTP stats.
How to derive it:
fps = (framesDecoded_now – framesDecoded_prev) / intervalSeconds
Thresholds:
| FPS | State | Note |
| > 24 | Smooth | Normal for video calls |
| 15–24 | Acceptable | Slight motion blur on fast movement |
| 8–15 | Degraded | Visible choppiness; impairs procedure viewing in clinical context |
| < 8 | Severely degraded | Slideshow; clinical detail lost |
Why it matters beyond general quality: In clinical telehealth contexts — wound assessment, range-of-motion evaluation, dermatology review — frame rate directly affects clinical utility. A frozen frame during a practitioner’s hand demonstration or a patient’s gait assessment isn’t just an annoyance; it’s a clinical information loss event.
Tracking outbound FPS separately tells you whether the local encoder is being throttled by CPU constraints (source FPS drops while network stats are healthy), or whether the network is the bottleneck (source FPS is healthy, but inbound FPS at the remote end drops).
6. Audio Level and Audio Concealment Rate
What it is: Two separate metrics that together characterize audio quality. audioLevel from media-source stats gives the volume level of the local microphone. concealedSamples from inbound-rtp gives the number of audio samples that were synthesized by the PLC algorithm to cover for lost packets.
Concealment rate derivation:
concealmentRate = (concealedSamples_now – concealedSamples_prev) /
(totalSamplesReceived_now – totalSamplesReceived_prev)
Thresholds for concealment rate:
| Rate | Impact | Action |
| < 2% | Imperceptible concealment | Normal |
| 2–8% | Occasional audio artifacts | Monitor |
| 8–15% | Frequent artifacts; clinical communication impaired | Alert |
| > 15% | Severe audio degradation | Alert: consultation quality at risk |
Audio level monitoring serves a different purpose: detecting muted or silent participants. A participant with an audio level near zero for more than 10 seconds is likely muted (intentionally or unintentionally). In a healthcare context where a practitioner is giving instructions or a patient is reporting symptoms, a muted participant who doesn’t realize they’re muted is a patient safety risk as much as a UX problem.
7. ICE Connection State Transitions
What it is: Not a getStats() metric, but an event — transitions on iceConnectionState and connectionState on the RTCPeerConnection object.
The states to track:
peerConnection.addEventListener(‘iceconnectionstatechange’, () => {
const state = peerConnection.iceConnectionState;
logStateTransition(‘ice’, state, sessionId, timestamp);
});
peerConnection.addEventListener(‘connectionstatechange’, () => {
const state = peerConnection.connectionState;
logStateTransition(‘connection’, state, sessionId, timestamp);
});
What the transitions tell you:
- checking → connected in under 3 seconds: healthy ICE negotiation
- checking → connected in 3–10 seconds: slow ICE, possibly falling back to TURN
- connected → disconnected → connected: brief network interruption, self-recovered
- connected → disconnected (no recovery in 5 seconds): connection failure, intervention needed
- connected → failed: hard failure, requires restart
Why this is a leading indicator: The transition from connected to disconnected precedes call failure. A brief disconnected period (under 3 seconds) typically self-recovers via ICE restart. A prolonged disconnected period is a warning you can act on — trigger an ICE restart programmatically, surface a quality warning to the user, or log the event for post-call analysis before the user reports anything.
From Raw Metrics to Operational Intelligence
Collecting these metrics is the first step. Making them useful requires three additional layers:
Session-level aggregation. Per-second stats are too granular for alerting and too fine-grained for post-call analysis. Aggregate to P50/P95/P99 over the session duration. A P95 packet loss of 6% tells you far more than the raw per-second timeseries.
Correlation across metrics. A single elevated metric is often benign. Packet loss above 3% and jitter above 50ms and RTT above 300ms simultaneously is a strong signal of a deteriorating connection. Build a composite quality score that weights the metrics you’ve instrumented — a simple weighted average works; more sophisticated approaches use historical data to tune weights per use case.
A simple composite quality score formula:
qualityScore = 100
– (packetLossRate * 15)
– (jitter_ms * 0.3)
– (rtt_ms * 0.1)
– (concealmentRate * 10)
– (fpsDegradationPenalty) // penalty if fps drops below threshold
Normalize to 0–100, where 100 is perfect and below 70 is user-noticeable degradation. Tune the weights against your own session data.
Pre-complaint alerting. The goal is to act before the user experiences a problem. A composite quality score dropping below 75 and trending downward over 30 seconds is an actionable signal — surface an in-call quality warning, trigger an ICE restart attempt, reduce video resolution proactively, or flag the session for immediate support review in high-stakes contexts like clinical consultations.
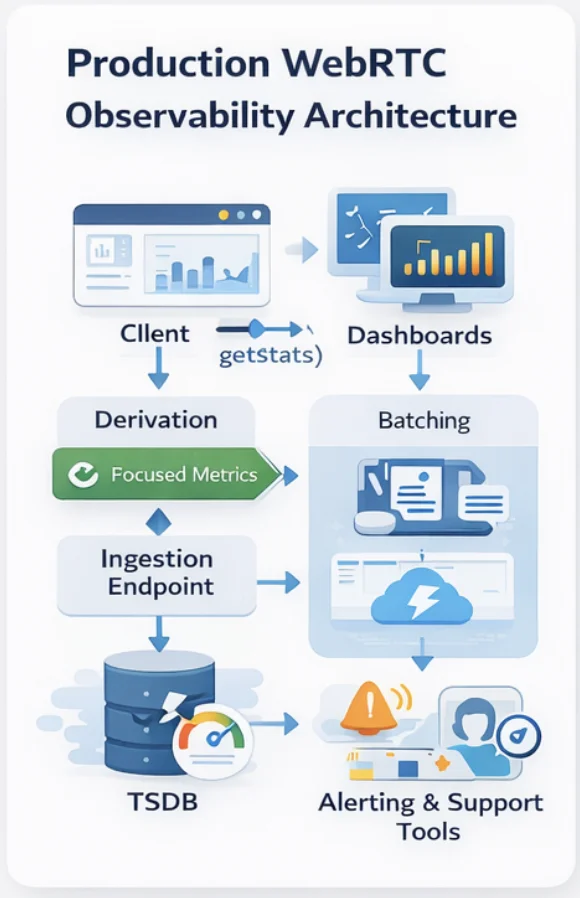
The Observability Stack That Supports This
Client-side collection: Poll getStats() every 1–2 seconds. Derive rates and deltas in the client. Batch stats into 10-second chunks before sending to avoid excessive network requests. Include session ID, participant ID, browser/device metadata, and timestamp with each batch.
Transport: A lightweight WebSocket or HTTP endpoint that accepts stats batches. Don’t use your main application API for stats ingestion — stats volume is high, and you don’t want it competing with signaling traffic.
Storage and querying: Time-series databases (InfluxDB, TimescaleDB, or managed equivalents like AWS Timestream or Grafana Cloud) are the right fit for WebRTC stats. Session-level summaries (P95 values, composite scores, state transition logs) belong in your main database for correlation with user records and support tickets.
Alerting: Session-level quality scores below the threshold trigger real-time alerts for support teams. Aggregate degradation across sessions (e.g., 10% of sessions in the last 5 minutes have a quality score below 70) triggers infrastructure alerts — this pattern suggests a systemic problem rather than individual user network issues.
What This Looks Like in Practice
A healthcare platform that instruments these seven metrics correctly can answer questions that previously required user reports:
- “Which sessions had quality problems in the last 24 hours, and what was the failure pattern?” — answered from session-level P95 aggregates.
- “Is this a user’s network issue or a platform issue?” — answered by comparing the user’s session quality against concurrent sessions.
- “Why did this consultation end early?” — answered by replaying the quality score timeline against ICE state transitions and connection events.
- “Are our TURN servers performing acceptably?” — answered by correlating RTT with ICE candidate type (relay vs. direct).
- “Is our video quality above the minimum threshold for clinical use?” — answered by FPS and concealment rate monitoring against defined clinical quality floors.
These are the questions that turn WebRTC monitoring from a debugging tool into a quality assurance system.
Building This the Right Way
Instrumenting WebRTC at this level is a week of careful engineering, not a day. The stats API is inconsistently implemented across browsers (Chrome, Firefox, and Safari each have gaps), the derivation logic has edge cases (counter wraps, stats resets on ICE restart), and the observability pipeline needs to handle the volume gracefully.
At Trembit, WebRTC observability is part of how we approach every real-time media system — not as an add-on, but as the foundation that makes everything else maintainable. We’ve built stats pipelines and quality scoring systems for healthcare video platforms where call quality has clinical consequences, and we’ve used them to identify and fix problems that users would never have been able to articulate.
If your WebRTC platform is flying blind in production — or if you’re building one and want observability designed in from the start — we’re worth talking to.
The goal is simple: you should know a call is going to fail before the user does.