Most telehealth engineering teams know their platform is “up.” What they don’t know — until a clinician files a complaint or a patient drops off mid-visit — is whether it’s working well.
The gap between “the server is running” and “calls are clinically usable” is where telehealth quality problems live. WebRTC quality is inherently variable: it depends on the patient’s home network, their device, their ISP, the clinician’s office WiFi, the time of day, and a dozen other factors outside your infrastructure’s control. Your monitoring system needs to see all of it — in real time, at the session level, with enough granularity to diagnose problems and enough coverage to catch patterns before they become complaints.
WebRTC.ventures has written about client-side monitoring tools like PeerMetrics. That’s a useful starting point. But healthcare adds requirements that generic WebRTC monitoring doesn’t cover: clinical workflow context, visit-level reporting, compliance traceability, and the organizational urgency that comes when a degraded call isn’t just a poor user experience — it’s a failed clinical encounter.
This article is the monitoring stack Trembit builds for production telehealth platforms. It covers what to measure, where to measure it, which tools to use, and how to turn raw WebRTC metrics into actionable quality intelligence.
Why Generic WebRTC Monitoring Falls Short in Healthcare
Standard application monitoring — uptime checks, server CPU, error rates — tells you when your infrastructure is failing. It doesn’t tell you whether a call between a patient in rural Montana and a clinician in Chicago was good enough to support a clinical decision.
The healthcare-specific monitoring gaps:
Session-level quality, not aggregate averages. A platform with 98% “good” calls has a 2% failure rate. At 10,000 visits per month, that’s 200 failed clinical encounters. Aggregate quality scores hide the tail — the patients with the worst connectivity, the device types that underperform, the geographic regions where your TURN coverage is thin.
Clinical context linkage. A degraded call means something different depending on whether it’s a medication refill check-in or an oncology consultation. Monitoring systems that don’t link call quality to visit type, provider, and patient cohort can’t support clinical quality improvement decisions.
HIPAA-compliant telemetry. WebRTC quality monitoring involves collecting data about sessions that contain PHI. Your monitoring pipeline — including third-party tools — must be HIPAA-compliant, with BAAs in place and PHI scrubbed from any data sent to external analytics services.
Proactive detection, not reactive reporting. In healthcare, the worst outcome is a patient who gives up on a failing call and doesn’t reschedule. They don’t file a complaint — they just don’t come back. Your monitoring must detect degrading calls in real time and trigger intervention before the patient disconnects.
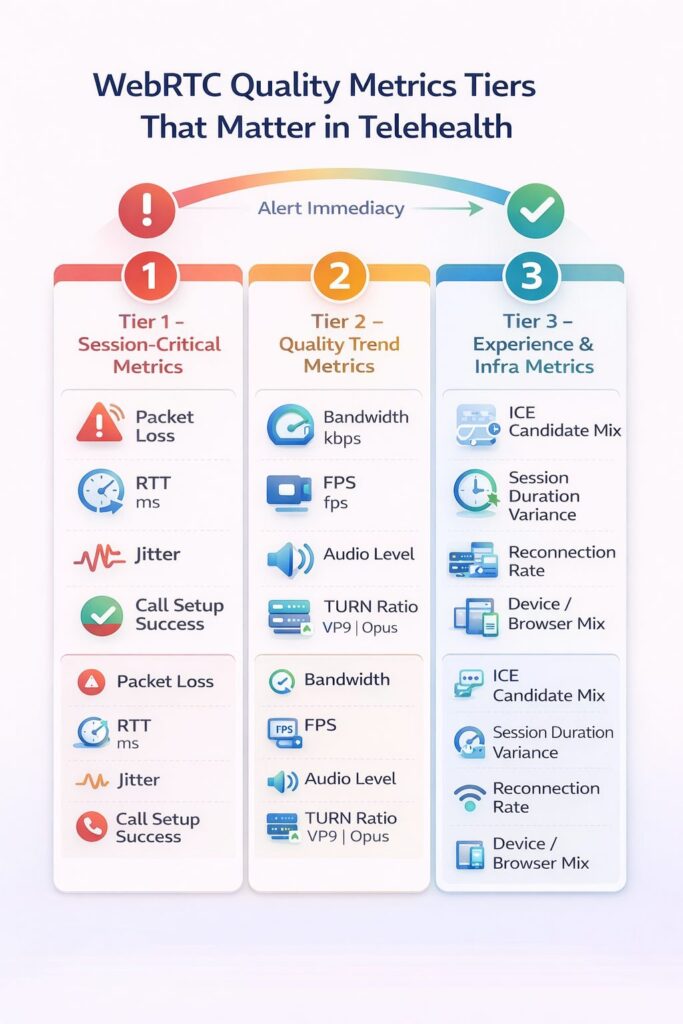
The Metrics That Actually Matter
WebRTC exposes a rich set of statistics via the getStats() API. Not all of them are equally useful for healthcare quality monitoring. These are the metrics that Trembit prioritizes in production systems:
Tier 1: Session-Critical Metrics
Monitor in real time. Alert immediately on threshold breach.
- Packet loss (%) — The single most important call quality indicator. Audio packet loss above 3% produces audible degradation; above 8%, speech becomes unintelligible. Video tolerates slightly higher loss before quality collapses.
- Round-trip time (RTT, ms) — The latency of the media path. RTT above 300ms creates noticeable conversation delay; above 500ms, conversational turn-taking becomes difficult, and clinical communication suffers.
- Jitter (ms) — Variance in packet arrival timing. Jitter above 30ms causes audio artifacts even when packet loss is low. Critical to monitor alongside the jitter buffer size.
- Call setup success rate (%) — The percentage of initiated sessions that successfully establish a media connection. Failures here are invisible to most monitoring systems but represent complete care delivery failures.
Tier 2: Quality Trend Metrics
Monitor per session. Aggregate for pattern detection.
- Available bandwidth (kbps) — Estimated by the WebRTC engine via REMB/TWCC feedback. Trending downward bandwidth predicts quality degradation before it’s perceptible.
- Frames per second (FPS) — Video frame rate is a leading indicator of encoding stress and bandwidth constraint. FPS dropping below 15 signals visible video degradation.
- Audio level / energy — Near-zero audio energy from a participant often indicates a muted microphone, the patient doesn’t know it is muted — a common source of “the doctor couldn’t hear me” complaints.
- TURN relay ratio — The percentage of sessions relying on TURN servers vs. direct P2P or SFU connections. High TURN relay adds latency and indicates ICE configuration or network issues.
- Codec negotiated — Which audio and video codecs were selected? Unexpected codec fallback (e.g., from VP9 to VP8, or from Opus to PCMU) often indicates compatibility issues worth investigating.
Tier 3: Infrastructure and Experience Metrics
Aggregate and review. Feed into capacity planning.
- ICE candidate type distribution — What proportion of sessions use host, server-reflexive, or relay candidates? Shifts in this distribution indicate changes in your user population’s network environment.
- Session duration vs. scheduled duration — Sessions that end significantly earlier than their scheduled time may indicate quality-driven patient or clinician disconnection, even when no error is logged.
- Reconnection rate — How often sessions recover from a transient failure. High reconnection rates indicate unstable connections that are technically “successful” but clinically degraded.
- Device and browser distribution — Quality patterns often correlate with specific device types or browser versions. Monitoring this enables targeted compatibility fixes.
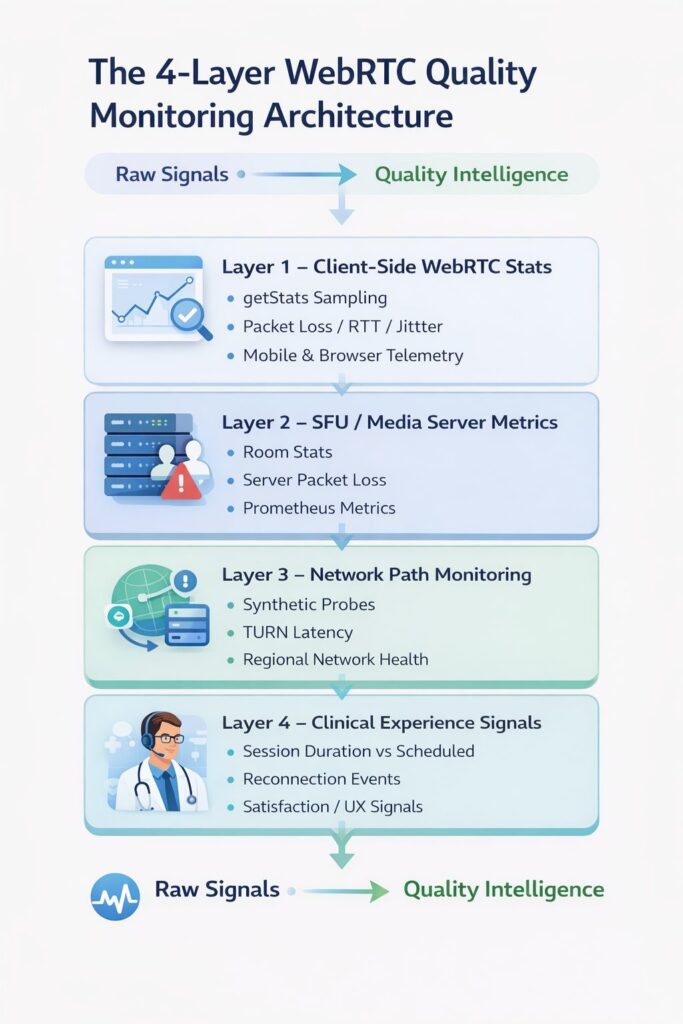
The Four Layers of a Complete Monitoring Architecture
Quality data lives in four places in a telehealth stack. Production-grade monitoring requires instrumentation at all four.
Layer 1: Client-Side WebRTC Stats
What it is: Raw metrics collected from the browser or native app via the WebRTC getStats() API, sampled every 1–2 seconds during the call.
What it captures: Packet loss, jitter, RTT, bandwidth estimates, codec information, frame rates, audio levels — everything the client can observe about its own media stream.
Implementation: A lightweight JavaScript SDK running in your call UI samples getStats at regular intervals and ships the data to your backend analytics pipeline. This can be custom-built or handled by tools like PeerMetrics, Callstats (now part of 8×8), or Agora’s own analytics SDK.
Healthcare caveat: Before sending client-side telemetry to any third-party tool, audit what data is included. Session identifiers that can be linked to patient records are PHI. Either anonymize at the client before transmission or ensure your tooling vendor has signed a BAA.
Layer 2: Server-Side SFU Metrics
What it is: Quality and performance data from your media server (LiveKit, mediasoup, Janus) about the sessions it’s routing.
What it captures: Room-level participant counts, track publish/subscribe status, server-side packet loss between SFU and participants, CPU and memory utilization, concurrent session counts.
Implementation: Most production SFUs expose Prometheus metrics endpoints. A standard Prometheus + Grafana stack with WebRTC-specific dashboards covers this layer well. LiveKit’s observability tooling is particularly mature and integrates cleanly with standard infrastructure monitoring.
Layer 3: Network Path Monitoring
What it is: Active monitoring of the network paths between your infrastructure and key geographic regions.
What it captures: Latency and packet loss on the path from your TURN/SFU servers to representative client locations, TURN server availability and response time, and DNS resolution performance.
Implementation: Synthetic monitoring agents (Catchpoint, ThousandEyes, or self-hosted probes using tools like Smokeping) placed in AWS/GCP regions closest to your patient population. Alerts when path latency exceeds thresholds that predict call quality degradation.
Layer 4: Clinical Experience Signals
What it is: Application-level signals that indicate whether the call served its clinical purpose, independent of technical metrics.
What it captures: Session duration vs. scheduled duration, in-call quality self-reports (a “How’s your connection?” prompt surfaced when quality metrics degrade), reconnection events, and post-visit satisfaction scores correlated with session quality data.
Implementation: Custom instrumentation in your telehealth application, correlated with the technical quality data from Layers 1–3 via a shared session identifier.
Tooling Comparison: Building vs. Buying
| Approach | Tools | Setup Complexity | Healthcare Suitability | Cost at Scale |
| Full custom | WebRTC getStats() + ClickHouse/BigQuery + Grafana | High | Excellent (full control) | Low marginal cost |
| PeerMetrics | PeerMetrics SDK + dashboard | Low | Moderate (BAA available, verify scope) | Per-session pricing |
| Callstats / 8×8 | Callstats.io SDK | Low | Moderate (verify BAA) | Per-session pricing |
| LiveKit built-in | LiveKit Egress + Prometheus | Medium | Good (self-hosted option) | Infrastructure cost only |
| Datadog + custom instrumentation | Datadog APM + custom WebRTC metrics | Medium | Good (BAA available) | Usage-based, expensive at scale |
| Grafana + Prometheus (self-hosted) | Open source stack | Medium-High | Excellent (no third-party data sharing) | Infrastructure cost only |
Trembit’s default recommendation for HIPAA-strict telehealth platforms: a self-hosted Prometheus + Grafana stack for infrastructure and SFU metrics, combined with a lightweight custom client-side stats collector that anonymizes session data before any external transmission. This gives full observability without PHI leaving your environment.
Alerting That Actually Helps
Raw metric dashboards are necessary but not sufficient. The alerting layer determines whether your team catches problems in time to intervene during a call rather than after it ends.
Real-time intervention alerts (fire during the session):
- Packet loss > 5% sustained for 30+ seconds → trigger in-app quality notification to both participants and alert on-call technical support.
- RTT > 400ms sustained for 60+ seconds → flag for TURN server review and prompt patient with connection troubleshooting tips
- Audio level near zero for participant > 45 seconds → surface “Are you muted?” prompt in UI
Session-level post-call alerts (fire within minutes of session end):
- Session ended > 10 minutes early vs. scheduled duration → flag for clinical quality review.
- Packet loss > 8% at any point during session → add to degraded session queue for root cause analysis.
- TURN relay used + RTT > 350ms → flag for geographic TURN coverage review
Trend alerts (fire on pattern detection):
- TURN relay rate increased > 5% week-over-week → indicates network environment change in patient population
- Call setup failure rate increased > 0.5% vs. 7-day baseline → indicates possible infrastructure or configuration regression.
- Quality degradation correlated with specific provider location → indicates clinic network issue.
Turning Monitoring Data Into Clinical Quality Improvement
The monitoring investment pays its biggest dividend when quality data informs decisions beyond the engineering team. Trembit helps telehealth clients build reporting layers that make quality data accessible to clinical operations and product leadership:
- Provider-level quality reports — average call quality scores by provider location, surfacing clinic network issues that IT needs to address
- Patient cohort analysis — quality patterns segmented by geography, device type, or insurance cohort, informing equity-focused platform improvements
- Visit type correlation — whether quality is disproportionately poor for specific visit types (initial consultations, behavioral health, complex care) that may warrant different technical handling
- Incident retrospectives — structured root cause analysis for quality incidents, linking client metrics, server metrics, and network path data into a single timeline
This layer is what separates telehealth platforms that treat quality monitoring as an engineering function from those that treat it as a clinical quality function. The second group makes faster improvements and builds more patient and clinician trust in their platform.
What Trembit Builds for Production Telehealth Monitoring
Quality monitoring is one of the areas where Trembit’s experience with production telehealth infrastructure makes the biggest practical difference. We’ve instrumented enough sessions across enough patient populations to know which metrics predict clinical dissatisfaction, which alert thresholds generate too much noise to act on, and which data correlations surface the most actionable insights.
Our monitoring engagements typically include a review of existing instrumentation, identification of visibility gaps, and implementation of a complete observability stack tailored to the platform’s SFU choice, EHR integration, and compliance requirements.
If your telehealth platform is running in production and you don’t have session-level quality visibility — or you have dashboards but they’re not connected to clinical quality outcomes — that’s a gap worth closing before it closes itself through patient complaints.
Talk to us about WebRTC monitoring for your platform.