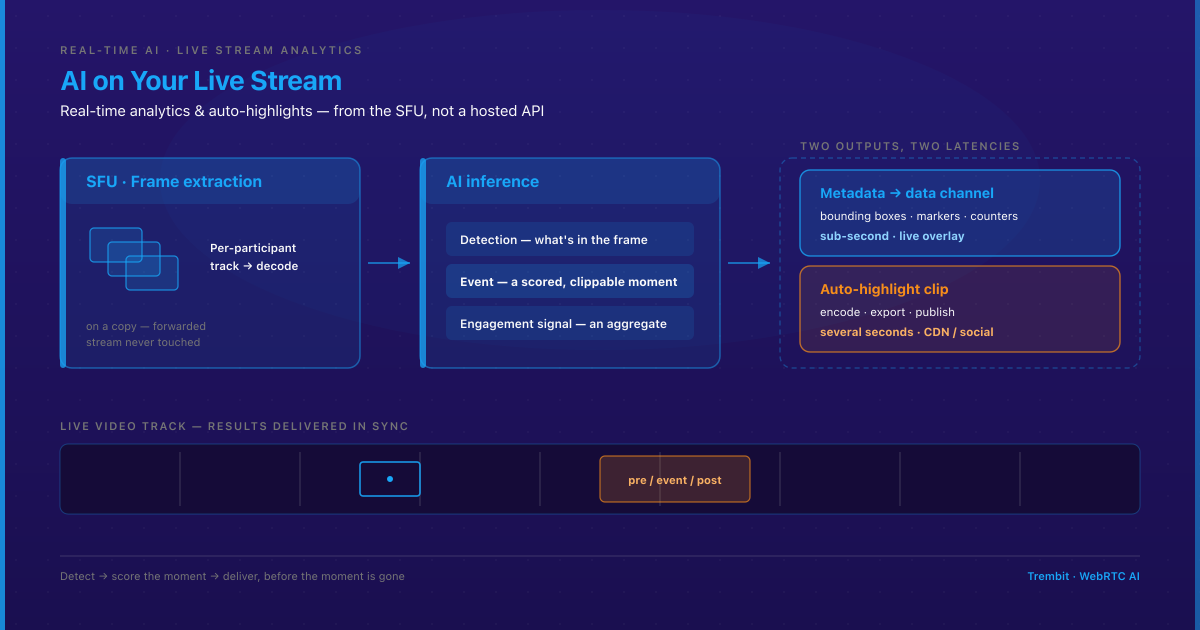
Real-time video analytics on a live stream means running AI inference on frames while the broadcast is still in flight — detecting objects and events, scoring which moments matter, and delivering the results (bounding boxes, highlight markers, engagement counts) back to viewers or an ops dashboard in sync with the video. Unlike post-broadcast highlight editing, it works against a hard latency budget: the answer has to land before the moment is gone.
What is real-time video analytics on a live stream, and how is it different from post-processing highlights?
Two jobs hide under “highlights,” and they demand different architectures.
Post-processing runs after the broadcast ends. You have a full recording — a file — and no latency constraint. You can run a heavy, accurate model over the whole thing, take minutes or hours, and produce a polished highlight reel. This is the right tool for a next-day recap package or an archive. What it cannot do is put a clip in front of viewers while the game is still on.
Real-time video analytics runs on live frames while the stream is in flight. It samples the media path, scores what it sees, and emits results — a highlight marker, a bounding box, an engagement counter — fast enough to be useful during the broadcast. This is what a sports platform needs to push a goal clip to social before the restart, what a live-commerce app needs to surface “viewers are reacting to this product right now,” and what an events platform needs to flag a highlight-worthy moment across a multi-camera feed.
The mechanics of pulling frames off an SFU are the same whether you’re moderating content or analyzing it: tap the per-participant RTP track, reassemble, decode at a controlled rate, hand frames to an inference service — all on a copy, so the forwarded stream is never touched. We cover that media-path layer in full in our real-time content-moderation architecture guide — the frame-extraction flow, the SFU-vs-CDN-vs-browser decision for where inference runs, and the detection→action latency contract. This piece picks up from there. Everything below is the analytics application layer that sits on top of that extraction plumbing: what you detect, how detections become highlights, and how the results get delivered.
How is this different from the managed services Oracle, AWS, and NVIDIA already sell?
Those services are real, they’re generally available, and they prove the commercial demand is here.
- Oracle shipped OCI Vision Streaming Video Analysis as a fully managed, GPU-accelerated service that detects and tracks objects, labels, text, and faces on live RTSP streams.
- AWS has offered Amazon Rekognition Streaming Video Events since 2022, delivering real-time detections (with bounding boxes, a hero image, and a timestamp) off live streams via Kinesis Video Streams — though it’s scoped to connected-home objects like people, pets, and packages.
- NVIDIA DeepStream is a GPU-accelerated SDK for building multi-stream video-analytics pipelines, widely used as the inference backbone for detection-and-tracking workloads.
Here’s the honest gap. Every one of those assumes you route a full RTSP or RTMP feed into their cloud and get results back. That’s a clean fit for a fixed camera or a single broadcast feed. It is not a clean fit when your product is a WebRTC application where each participant is a separate track demuxed at your SFU, and you need per-stream or per-participant frame access inside your own media path — for latency, for cost per concurrent stream, or because the stream never becomes a single RTSP source in the first place. The WebRTC-native builder’s path is the one those docs don’t cover. That’s the one below.
What can real-time AI actually detect on a live stream? (the analytics layer, not the extraction layer)
Once frames are coming off the SFU, the model side is standard computer vision. The reference detector for real-time work is a YOLOv11-class model (Ultralytics YOLO11, released September 2024): a single-pass object detector that runs fast enough for live video and ships pretrained on common object classes, with a custom head trainable for your domain. It’s the same model family a moderation pipeline uses; only the classes and the downstream logic change.
The important distinction is not which model — it’s the three different outputs the analytics layer produces, because each one feeds a completely different downstream:
- Detection — what’s in this frame, right now. “Ball at (x, y),” “product held up to camera,” “face count = 340.” A raw, per-frame observation with a confidence score. On its own it drives live overlays (bounding boxes, object tracking) but nothing more.
- Event — a scored, timestamped moment worth acting on, assembled from a sequence of detections over time. “Goal at 00:42:17,” “product demonstrated,” “crowd surge.” An event is what you clip or flag. It is not a single detection — it’s a pattern of detections crossing a rule.
- Engagement signal — an aggregate, not a moment. “Reaction rate up 3× over baseline in the last 10 seconds,” “average dwell on this product = 8s.” This feeds a dashboard or a recommendation loop, not a clip.
Getting this taxonomy straight is what keeps the pipeline sane. Detections are cheap and noisy. Events are the expensive, high-value output — and turning the first into the second is where the real engineering lives.
The detection classes that matter differ by vertical:
| Vertical | What you detect (detections) | What becomes an event |
|---|---|---|
| Sports | Player, ball/puck position, goal region, score-change cues | Goal, big play, key possession change |
| Live commerce | Product in frame, presenter gesture, on-screen price/CTA, reaction density | Product demonstrated, price reveal, engagement spike |
| Events | Face/crowd density, stage vs. audience scene, active-speaker region | Scene change, crowd surge, headline moment |
How do you turn AI detections into auto-highlights?
This is the core of a live-analytics pipeline, and it’s the part the managed-service docs are quietest about — because it’s product logic, not a hosted API call. The flow has four stages, and each adds real time on top of the detection latency.
detections → event scoring + threshold → clip boundary selection → encode/export → publish (live) (rule layer) (pre-roll / post-roll) (real seconds) (CDN/social)1. Event scoring and threshold. A stream of per-frame detections gets aggregated into a candidate event with a single confidence score — usually by requiring a pattern to hold over a short window (e.g. ball crossing the goal line and a score-change cue and a crowd-audio spike), not by trusting one frame. The score is what a threshold acts on.
2. Clip boundary selection. An event has a timestamp, but a highlight is a span. You select a pre-roll (seconds before the trigger — the build-up to the goal) and a post-roll (seconds after — the celebration). This is why every live-analytics pipeline runs against a rolling buffer of recent media: when the event fires at 00:42:17, the pre-roll footage is already in the past, so you must have been buffering it. Get the boundaries wrong and the clip either misses the setup or drags past the moment.
3. Encode and export. The selected span is cut, encoded to a distributable format (typically H.264/HLS or MP4), and packaged. This is not free and not instant — it’s the stage that separates “we detected the goal” from “the clip is downloadable,” and it’s the one people forget when they promise “instant highlights.”
4. Publish. The encoded clip is pushed to its destination — a CDN, a social endpoint, an in-app highlight rail — usually with the event metadata (timestamp, type, confidence) attached for tagging and search.
What makes a detected event “highlight-worthy”? (confidence threshold + business-rule layer)
Don’t invent a new framework for this — the two-tier confidence model works exactly the way it does in moderation, just with a different action on the other end.
In our moderation guide, a raw model score isn’t an action: a high band auto-enforces, a middle band routes to a human review queue, and everything below is ignored. Highlight generation reuses that structure precisely:
- High-confidence band → auto-clip and auto-publish. An unambiguous goal, a clean product reveal — the pipeline generates and pushes the clip with no human in the loop. This is the sub-minute-turnaround path.
- Middle band → editor review queue. A candidate that scored high enough to matter but not high enough to trust unattended — a possible big play, a scrappy goal-mouth scramble. The clip is generated and staged, and a human editor confirms, trims, or discards before it goes live. This is where you protect brand safety and clip quality without throwing away the moment.
- Below threshold → discarded (or logged as an engagement signal, never as a clip).
The cutoffs are a business-rule choice, not a technical constant — the same way a moderation team picks where to draw its auto-action line. A creator platform chasing volume drops the auto-publish bar and accepts a few weak clips; a premium sports rights-holder raises it and leans on the editor queue, because a wrong auto-published clip is a reputational cost. The business-rule layer sits on top of the raw score: “only auto-publish goals from the home team’s attacking third,” “never auto-clip during a sponsor read,” “require two corroborating signals for a red-card event.” That rule layer is where your product’s judgment lives; the model just supplies the confidence.
What’s the realistic latency between an event happening and a clip being available?
Be honest with your product team about this, because “real-time highlights” quietly means two different things.
The metadata — “a goal just happened, here’s the timestamp and confidence” — is fast. It’s the detection latency (frame extraction + inference, the numbers quantified in the moderation guide, typically well under a second at 2 fps sampling) plus the event-scoring window. An overlay or a “goal!” ticker can fire in that budget.
The published clip is slower, and encoding is why. On top of detection latency you add clip-boundary assembly, the encode/export step, and the push to the destination. Encoding a few seconds of HD footage and packaging it for delivery is a genuine several-seconds-to-tens-of-seconds operation depending on clip length, resolution, and how much hardware you throw at it. That’s still “sub-minute” and well inside the 2026 competitive bar, but it is not the same as the metadata latency, and conflating the two is how teams overpromise.
The trade-off is a dial, not a fixed point:
- Tighter latency, lower polish — for live overlays and instant social alerts, you fire on metadata fast and accept a rougher clip.
- Looser latency, higher polish — for a broadcast-quality highlight, you spend a few extra seconds on encode, re-check the boundaries, and let the editor queue catch the middle band.
You set that dial per output, not per pipeline. The same detection can feed a sub-second overlay and a 20-second-later polished clip.
How do you deliver AI analytics metadata back to the client in sync with the video?
Detections and events are only useful if they reach the viewer’s client — or an ops dashboard — aligned with the video they describe. A bounding box that arrives 400ms after the frame it belongs to is worse than no box; it boxes the wrong thing.
For a WebRTC application, the natural carrier is the RTCDataChannel — the same peer connection already carrying the media also gives you a low-latency, ordered (or unordered, your choice) channel for arbitrary data alongside it. You send analytics payloads — bounding-box coordinates, event markers, engagement counters — as small messages down that channel, each stamped with the media timestamp of the frame it was computed from. The client buffers and renders each payload against the matching presentation time of the video track, so the box lands on the right frame instead of the current one.
Three things matter specifically for analytics metadata:
- Timestamp every payload with the source frame’s media time, not wall-clock send time — that’s what lets the client re-align a payload that arrived late.
- Keep payloads small and rate-limited. Bounding boxes at 30 fps for many tracked objects is a lot of messages; sample and coalesce to the rate the UI actually renders.
- Decide ordered vs. unordered per stream. Sequential event markers want ordering; a fire-and-forget engagement counter can tolerate loss for lower latency.
Beyond that, the general mechanics of data-channel setup, message framing, congestion behavior, and A/V-to-data sync are a topic in their own right — and not analytics-specific — so this guide stops here rather than re-deriving them.
How does real-time video analytics work for sports — event detection and auto-clipping?
Sports is the demanding case: fast motion, brief windows, and an audience that expects the clip now. The detection classes are player and ball/puck position, goal or scoring regions, and score-change cues; the events are goals, big plays, and key possession changes.
The competitive bar in 2026 is sub-minute turnaround from event to shareable clip, driven by TikTok-native attention spans — a goal clip that shows up three minutes later has already lost the moment. That bar is exactly why the two-tier model matters here: unambiguous goals ride the high-confidence auto-publish path for speed, while scrappier candidate plays stage into the editor queue so a human can confirm before a wrong clip goes out under a rights-holder’s brand. Auto-tagging each clip with event type, timestamp, and confidence at generation time is what makes the downstream distribution — social, in-app rails, search — work without a manual logging desk.
This is the architecture pattern that applies to sports platforms; we’re describing the pipeline shape, and the same extraction-and-scoring layer that carries the live-commerce and events cases below.
How does real-time video analytics work for live commerce — engagement and product-recognition signals?
Live commerce is where analytics ties most directly to revenue, and where the outputs skew toward signals over clips. The detection classes are product-in-frame, presenter gesture, on-screen price or CTA, and reaction density; the events are a product demonstration or a price reveal; the engagement signals are dwell time per product and reaction-rate spikes.
The useful move is aligning the analytics to the funnel. When product recognition fires (a presenter holds up an item) and an engagement spike lands in the same window, that’s the moment to surface the buy-now CTA, pin the product, or feed a “trending now” rail — computer-vision timing driving merchandising in real time. The same product-demonstration event also makes a natural auto-highlight for replay and short-form distribution after the show.
This is the architecture pattern we’ve used for live-commerce clients — SFU-layer frame access feeding product and engagement detection, with results delivered back over the data channel to drive the on-screen commerce UI. If you’re mapping the landscape of where this plugs in, our roundup of live-commerce streaming platforms covers the product side of that market.
How does real-time video analytics work for live events — crowd and engagement analytics?
Events and creator platforms use the same pipeline for a different question: not “what’s the score” but “what’s the room doing.” The detection classes are face and crowd density, stage-vs-audience scene classification, and active-speaker or active-camera region; the events are scene changes and crowd surges; the engagement signals are attendance density and reaction trends over time.
Two applications stand out. Scene-change detection across a multi-camera event feed flags cuts and stage transitions automatically, which both drives an auto-highlight of the headline moment and gives a director’s dashboard a live map of what each camera is showing. Crowd and engagement analytics turn face-density and reaction trends into an attendance and energy read-out an events team can act on mid-show — where the room is engaged, when it’s dipping — without a manual headcount. Same extraction, same scoring layer, same data-channel delivery; only the detection classes and the business rules change.
What does a real-time video analytics pipeline cost, and what latency does each stage add?
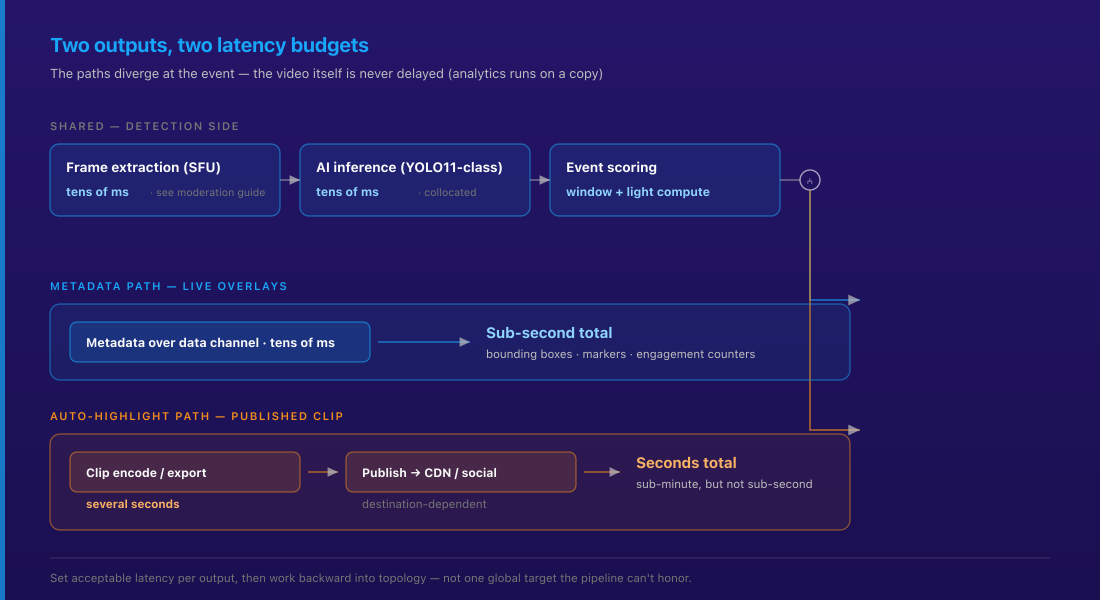
Roll the stages up into one honest latency budget. The extraction and inference numbers are quantified in the moderation guide — cross-referenced here, not re-derived — and this piece adds the two downstream paths that diverge from the same detection step.
| Stage | Adds | Path |
|---|---|---|
| Frame/track extraction at the SFU | tens of ms (see moderation guide) | both |
| AI inference (YOLOv11-class, collocated) | tens of ms (see moderation guide) | both |
| Event scoring over a short window | window length + light compute | both |
| Metadata delivery over data channel | tens of ms | live-overlay path |
| Clip encode / export | several seconds | auto-highlight path |
| Publish to CDN / social | destination-dependent | auto-highlight path |
The two paths diverge at the event: the metadata path (overlays, live signals, instant alerts) is a sub-second total; the auto-highlight path (a published, encoded clip) is dominated by encode and export and lands in seconds. Cost is per-concurrent-stream, the same crossover the moderation guide describes — every active source you sample consumes decode-and-inference capacity, and above a few hundred concurrent streams self-hosted GPU inference beats per-frame managed-API pricing.
The explicit trade-off to design around: tighter latency buys against clip polish, and per-stream cost buys against sampling rate. Fix your acceptable numbers per output — overlay vs. highlight — then work backward into topology, rather than chasing one global latency target the whole pipeline can’t honor.
How does Trembit build real-time video analytics into a live stream?
Trembit builds analytics into the WebRTC media path itself, not on top of it. Because we work at the SFU level across Mediasoup, LiveKit, and Janus — the depth behind our SFU comparison for real-time platforms — the frame-extraction tap sits where the per-participant tracks already live, and the analytics layer scores clean, demuxed sources instead of reconstructing them downstream. That’s the same protocol-layer work behind our WebRTC engineering practice, where real-time AI fits into the live media path rather than being bolted onto the application after the fact.
Concretely, the pattern this guide describes is one we’ve deployed for live-commerce clients: an SFU-layer extraction tap feeding product and engagement detection, with event scoring on a two-tier confidence model and results delivered back over the data channel to drive the on-screen commerce UI — on a copy, so the forwarded stream is never degraded. The same shape carries to sports auto-clipping and event analytics; what changes is the detection classes and the business-rule layer, not the plumbing.
If you’re being asked to add real-time analytics or auto-highlights to a stream that already runs, a free 30-minute architecture call gives you three concrete outputs: where the analytics tap should insert in your media path, a latency-budget split between the live-overlay path and the auto-highlight path for your target turnaround, and an event-scoring/threshold model matched to your quality-vs-volume trade-off. Bring the specific decision you’re stuck on — SFU topology, encode-time budget, the confidence cutoff for auto-publish — and we’ll pressure-test it. No deck, no pitch. Book a free consultation.